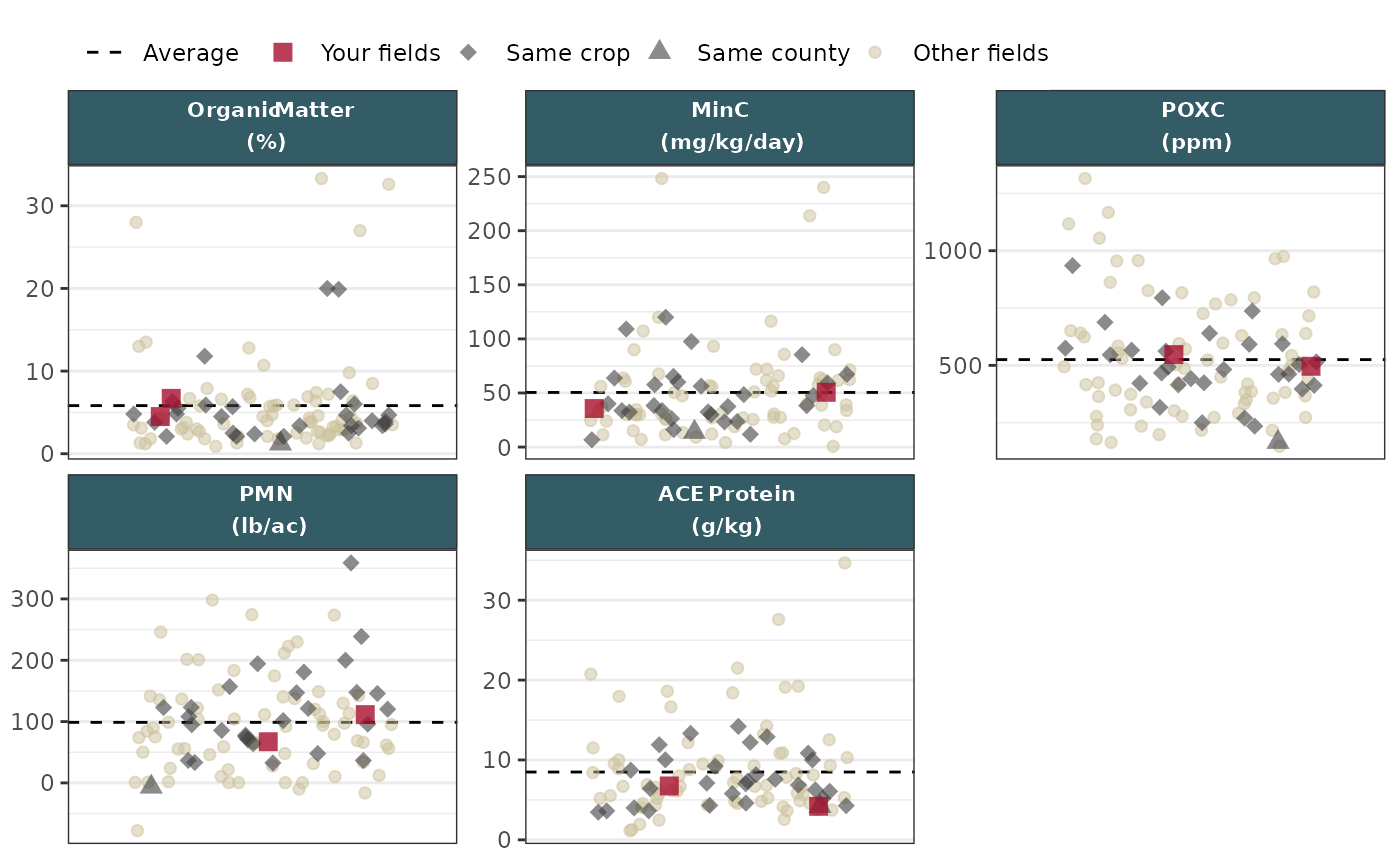
Theme for facetted strip plots
Usage
theme_facet_strip(
  ...,
  body_font = "Poppins",
  strip_color = "#335c67",
  strip_text_color = "white"
)
Arguments
- ...
Other arguments to pass into
ggplot2::theme().- body_font
Font family to use throughout plot. Defaults to
"Poppins".- strip_color
Color of facet strip background. Defaults to WaSHI blue.
- strip_text_color
Color of facet strip text. Defaults to white.
Examples
# Read in wrangled example plot data
df_plot_path <- soils_example("df_plot.RDS")
df_plot <- readRDS(df_plot_path)

# Subset df to just biological measurement group
df_plot_bio <- df_plot |>
  dplyr::filter(measurement_group == "biological")

# Make strip plot with all measurements and set scales based on
# the category column and then apply theme.

# NOTE: the plot gets piped into the `set_scales()` function, which gets
# added to `theme_facet_strip()`.

make_strip_plot(
  df_plot_bio,
  x = dummy,
  y = value,
  id = sample_id,
  group = abbr_unit,
  tooltip = label,
  color = category,
  fill = category,
  size = category,
  alpha = category,
  shape = category
) |>
  set_scales() +
  theme_facet_strip(body_font = "sans")


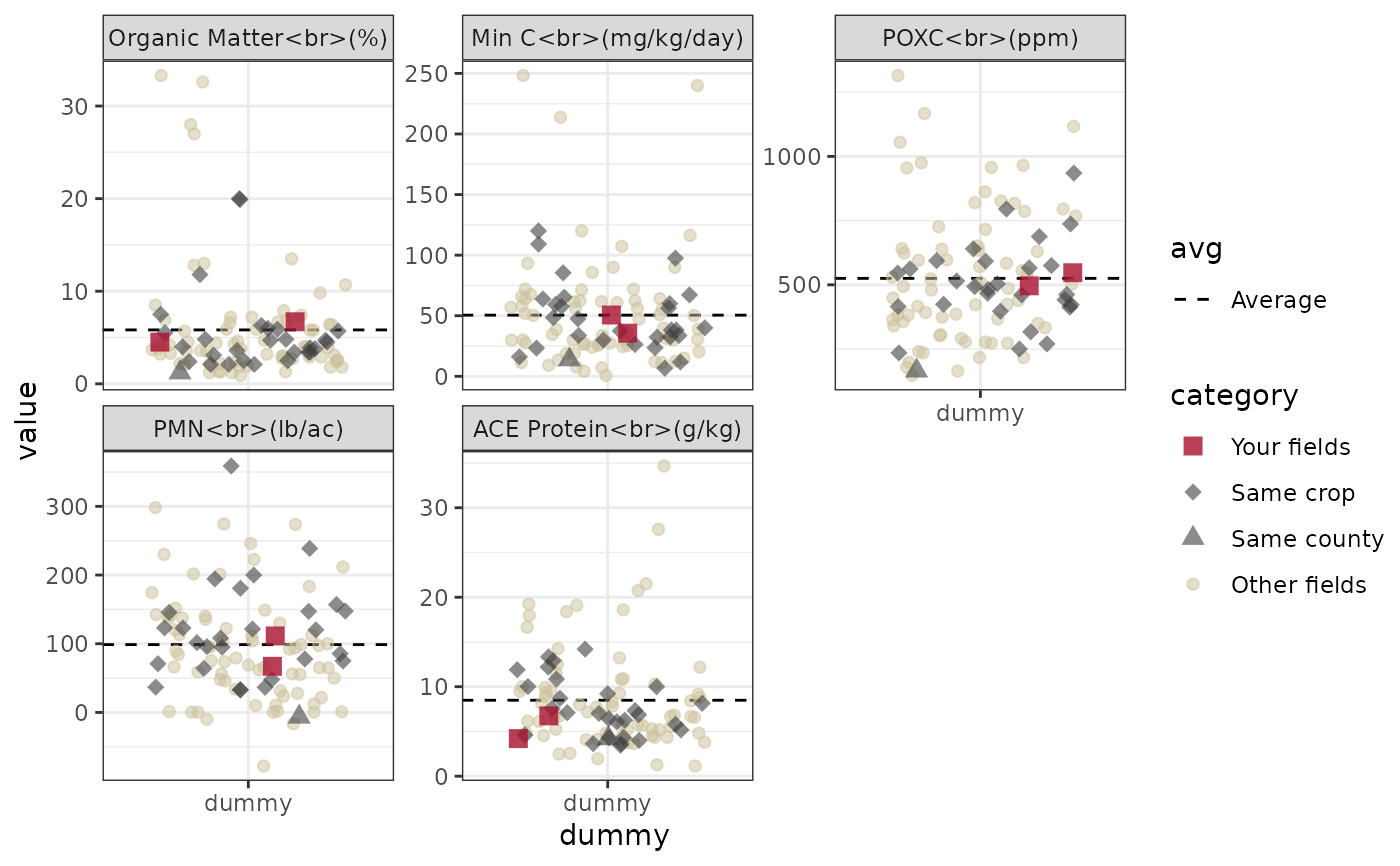
# Example without setting theme
make_strip_plot(
  df_plot_bio,
  x = dummy,
  y = value,
  id = sample_id,
  group = abbr_unit,
  tooltip = label,
  color = category,
  fill = category,
  size = category,
  alpha = category,
  shape = category
) |>
  set_scales()

