Define styles for producer's samples versus all samples
Usage
set_scales(
  plot,
  primary_color = "#a60f2d",
  secondary_color = "#3E3D3D",
  other_color = "#ccc29c",
  language = "English"
)
Arguments
- plot
ggplotobject to apply scales to.- primary_color
Color of producer's sample points. Defaults to WaSHI red
- secondary_color
Color of sample points with
"Same crop"or"Same county"values in thecategorycolumn. Defaults to WaSHI gray.- other_color
Color of sample points with
"Other fields"value incategorycolumn. Defaults to WaSHI tan.- language
Language of the legend.
"English"(default) or"Spanish".
Examples
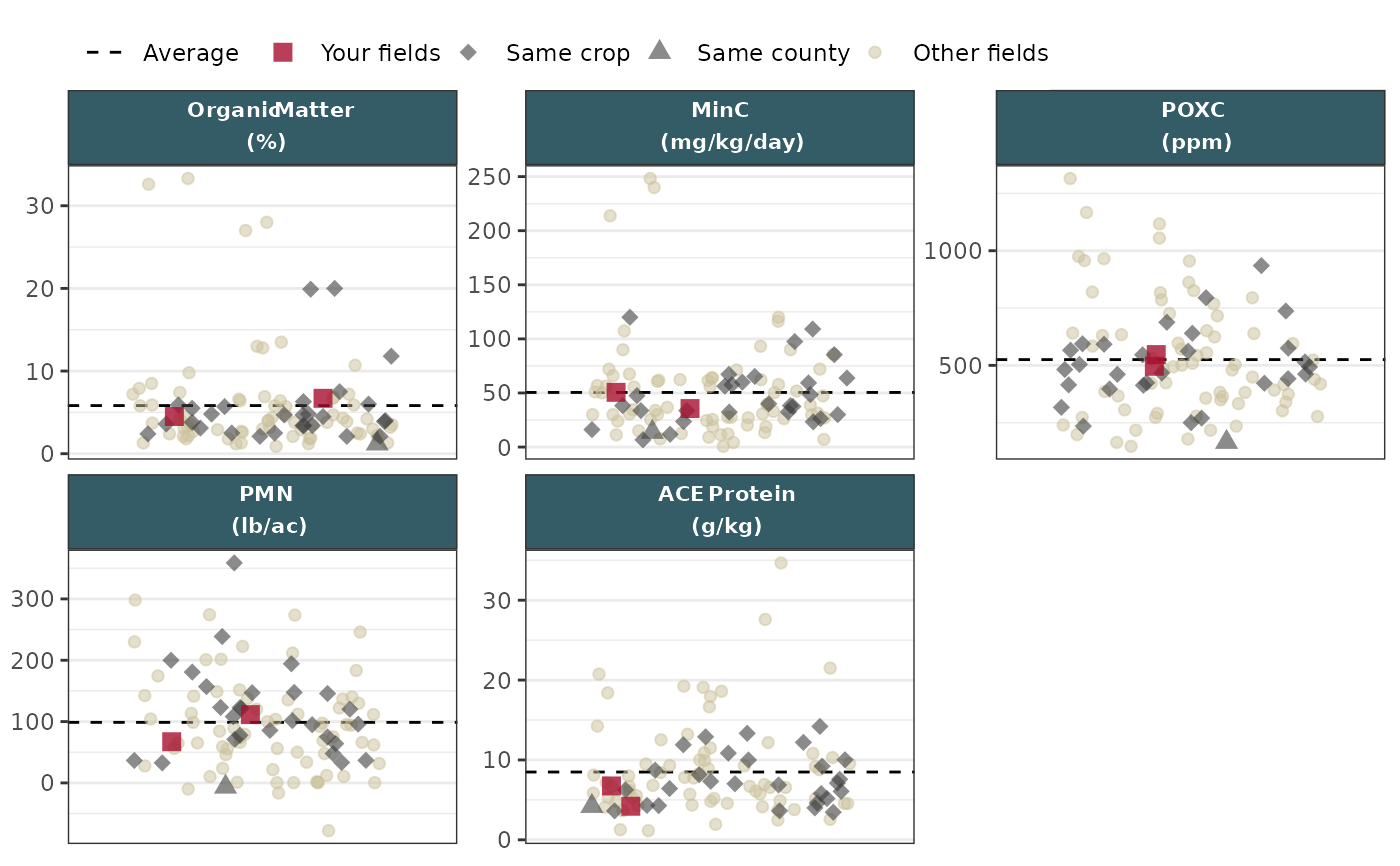
# Read in wrangled example plot data
df_plot_path <- soils_example("df_plot.RDS")
df_plot <- readRDS(df_plot_path)
# Subset df to just biological measurement group
df_plot_bio <- df_plot |>
  dplyr::filter(measurement_group == "biological")

# Make strip plot
make_strip_plot(
  df_plot_bio,
  x = dummy,
  y = value,
  id = sample_id,
  group = abbr_unit,
  tooltip = label,
  color = category,
  fill = category,
  size = category,
  alpha = category,
  shape = category
) |>
  set_scales() +
  theme_facet_strip(body_font = "sans")


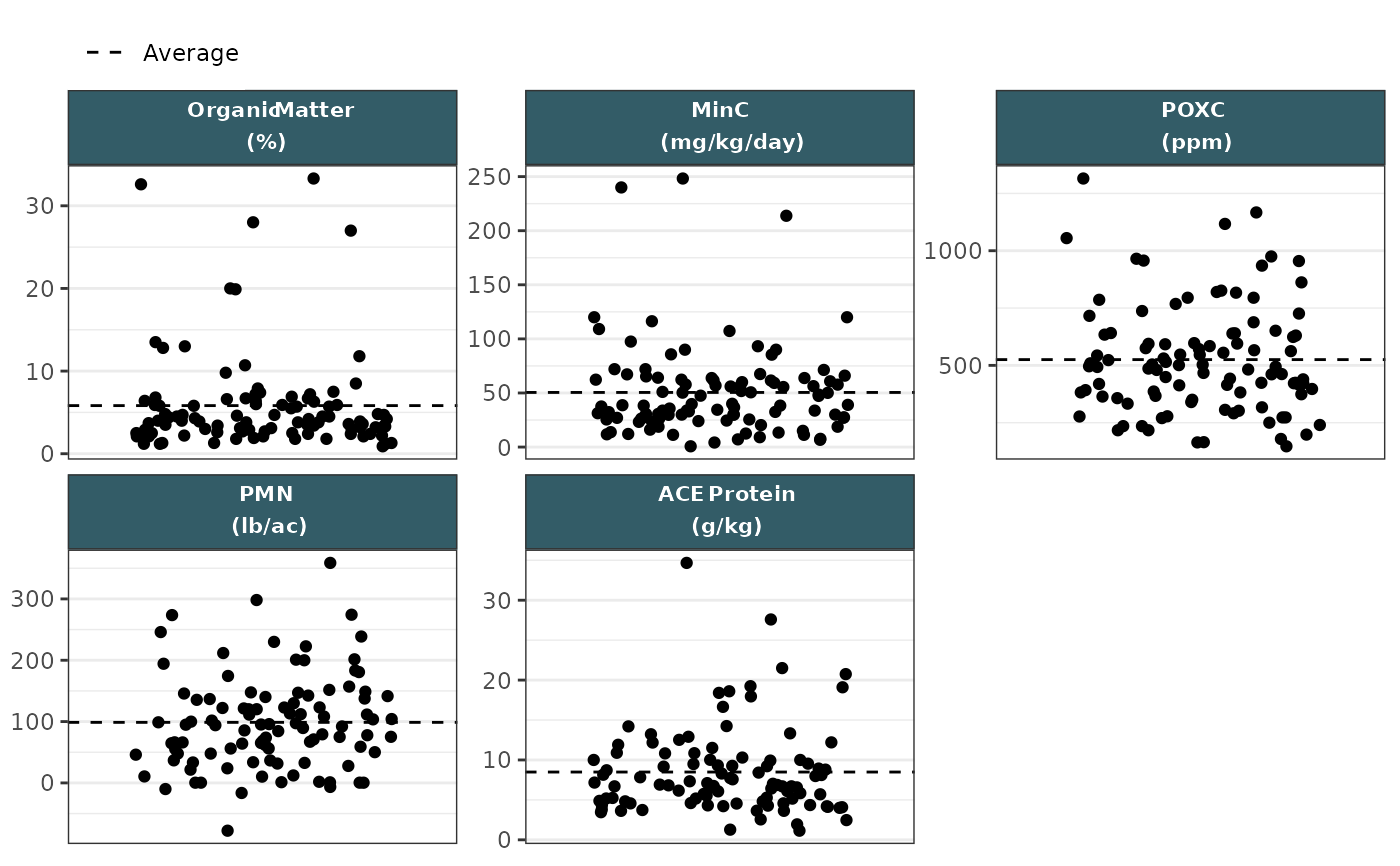
# Example without setting scales
make_strip_plot(
  df_plot_bio,
  x = dummy,
  y = value,
  id = sample_id,
  group = abbr_unit,
  tooltip = label
) +
  theme_facet_strip(body_font = "sans")

