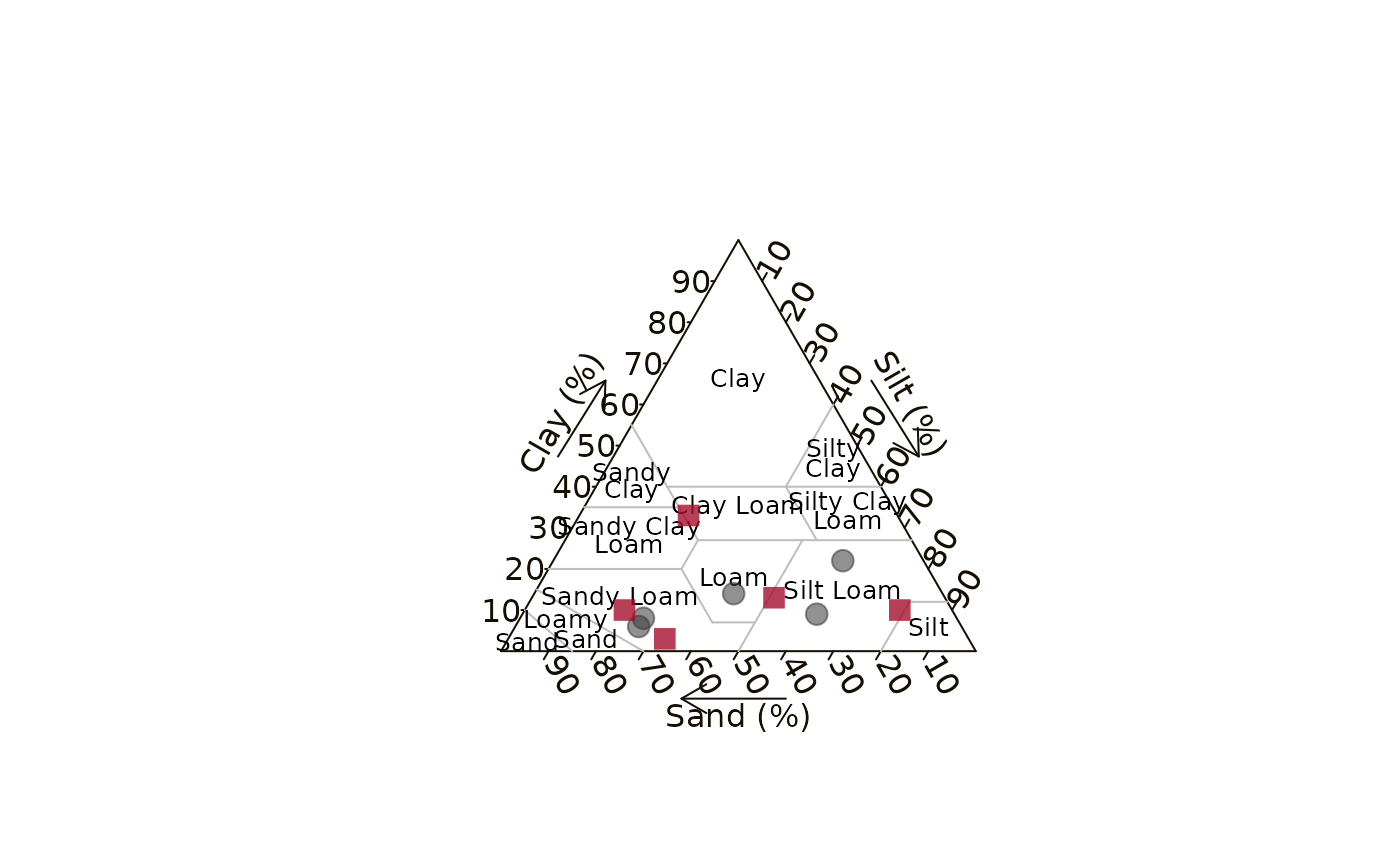
To vary color, symbol, and size of points by a grouping variable, call this function once for each value of the grouping variable. Add layers from bottom to top. The below example adds the red points last so they are plotted on top of the gray points.
Source
Adapted from plotrix: https://github.com/plotrix/plotrix/blob/0d4c2b065e2c2d327358ac8cdc0b0d46b89bea7f/R/soil.texture.R
Arguments
- texture_df
Data frame or matrix where each row is a soil sample and three numeric columns contain sand, silt, and clay percentages or proportions. The order of sand, silt, clay is required for correct plotting.
- color
Color of the points. Defaults to WaSHI red.
- pch
Numeric value of plotting symbol. See
graphics::points()for options and details. Defaults to 19, which is a filled-in circle.- size
Numeric expansion factor for points. Defaults to 1.5.
- ...
Other arguments passed to
graphics::points().
Examples
texture <- soils::washi_data |>
  dplyr::select(
    sand = sand_percent,
    silt = silt_percent,
    clay = clay_percent
  )

make_texture_triangle(body_font = "sans")

# Add gray points
add_texture_points(
  tail(texture, 5),
  color = "#3E3D3D90",
  pch = 19
)

# Add red points
add_texture_points(
  head(texture, 5),
  color = "#a60f2dCC",
  pch = 15
)


# Note the text appears squished in this example since the width, height,
# and resolution have been optimized to print the figure 6 in wide in the
# report.
# Note the text appears squished in this example since the width, height,
# and resolution have been optimized to print the figure 6 in wide in the
# report.