Installation
Install the development version of {soils} from our r-universe with:
install.packages(
  "usethis",
  repos = c(
    "https://wa-department-of-agriculture.r-universe.dev",
    "https://cloud.r-project.org",
    "https://ftp.osuosl.org/pub/cran/",
    "https://mirrors.dotsrc.org/cran/"
  )
)
Create the Project
There are two ways to create the {soils} project in RStudio.
Option 1. RStudio Project Wizard
The easiest and recommended way is to use the RStudio IDE to create a new {soils} RStudio project.
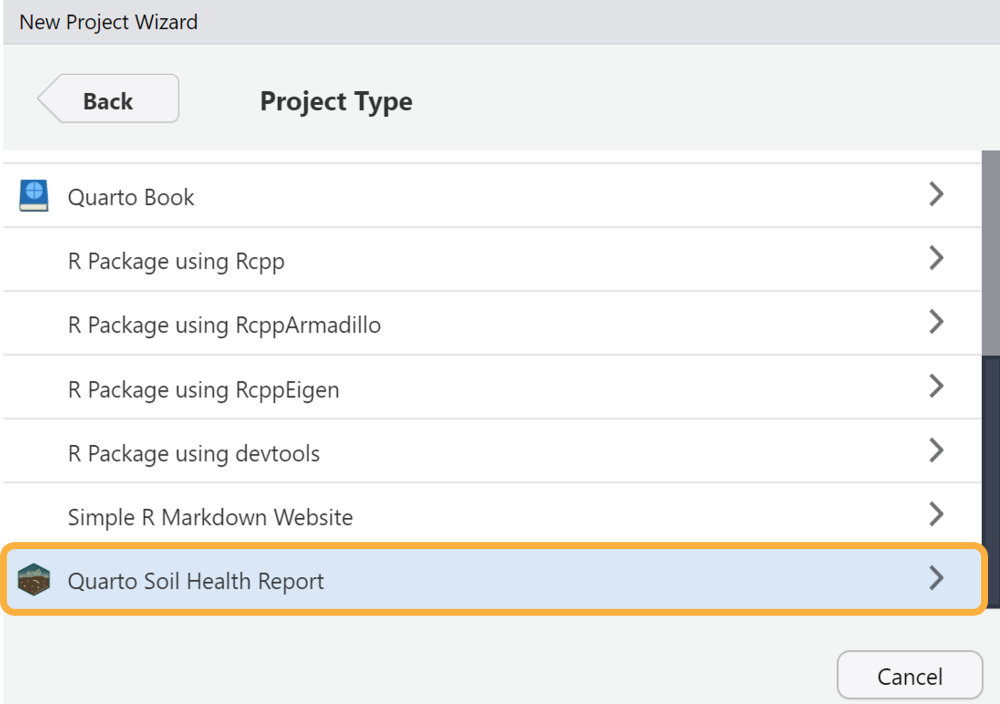
Open RStudio > File >
New Project > New Directory >
Quarto Soil Health Report
Enter your desired directory name, browse to where you want the project to live, and check whether you want the project to open in a new RStudio session.

A new RStudio project will open with the template Quarto report and a script to render all reports. Other documents and resources will appear in the files pane.

Option 2. RStudio Console
In the console, replace the path with where you would like the project directory to be created:
soils::create_soils(path = here::here("soils-demo"))The following will print in your console:
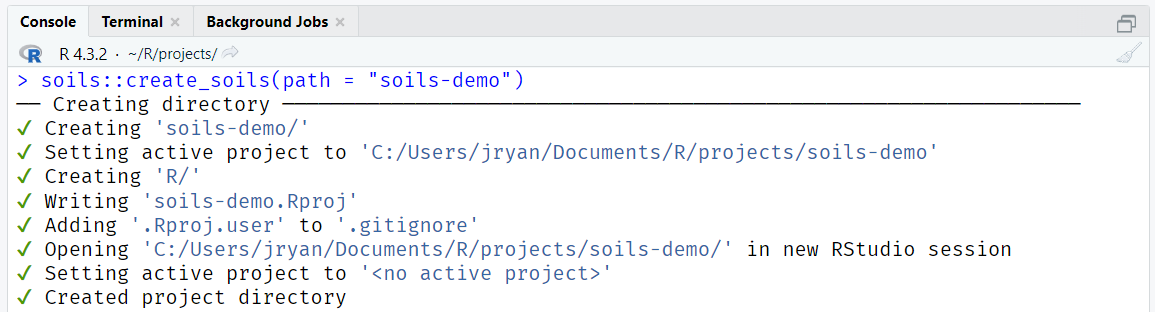
This option populates your project directory with all the template
files; however, it doesn’t open the main template Quarto file
01_producer_report.qmd or R script
render_reports.R.
Project Structure
Both options will create and launch a new RStudio project with the following files:
Project Directory and Files
├── 01_producer_report.qmd
├── 02_section_template.qmd
├── 03_project_summary.qmd
├── 04_soil_health_background.qmd
├── 05_physical_measurements.qmd
├── 06_biological_measurements.qmd
├── 07_chemical_measurements.qmd
├── 08_looking_forward.qmd
├── 09_acknowledgement.qmd
├── data
│   ├── data-dictionary.csv
│   └── washi-data.csv
├── images
│   ├── biological.png
│   ├── chemical.png
│   ├── logo.png
│   └── physical.png
├── R
│   └── render_reports.R
├── resources
│   ├── styles.css
│   └── word-template.docx
└── soils-demo.Rproj
Render the Example Report
Let’s render the example report with the dummy built-in data without
making any changes just to make sure your system is set up correctly.
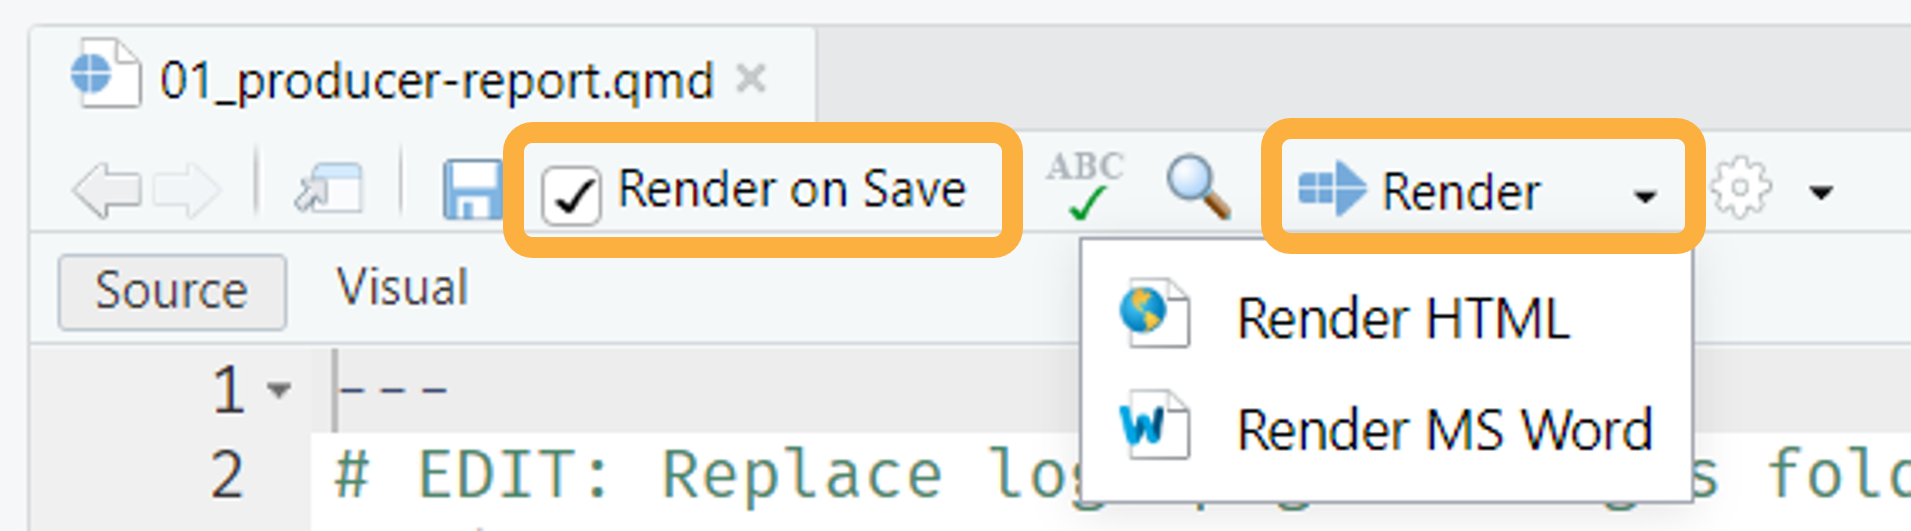
Open 01_producer_report.qmd and click the
Render button at the top of the file to generate either the
HTML or MS Word report.
If rendering to HTML, you can check the Render on Save
option to automatically update the preview whenever you save the
document.
This will render the MS Word Example or HTML Example, depending on which render option you selected.
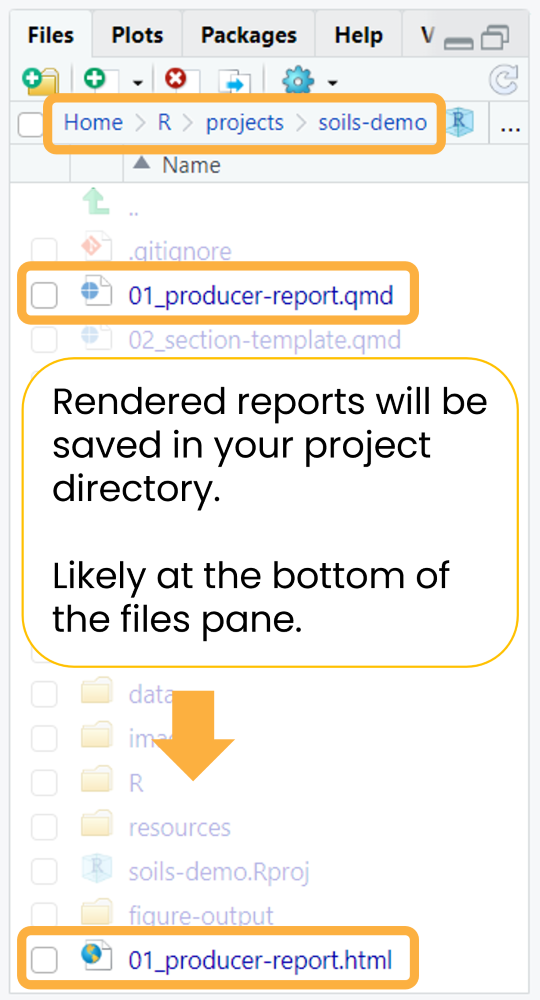
If the rendered report doesn’t immediately open, you can find it in
your project directory with the same name as the main Quarto
.qmd file (01_producer_report.qmd.
Render a Report with Your Data
Now try rendering the report with your own data.
Open the
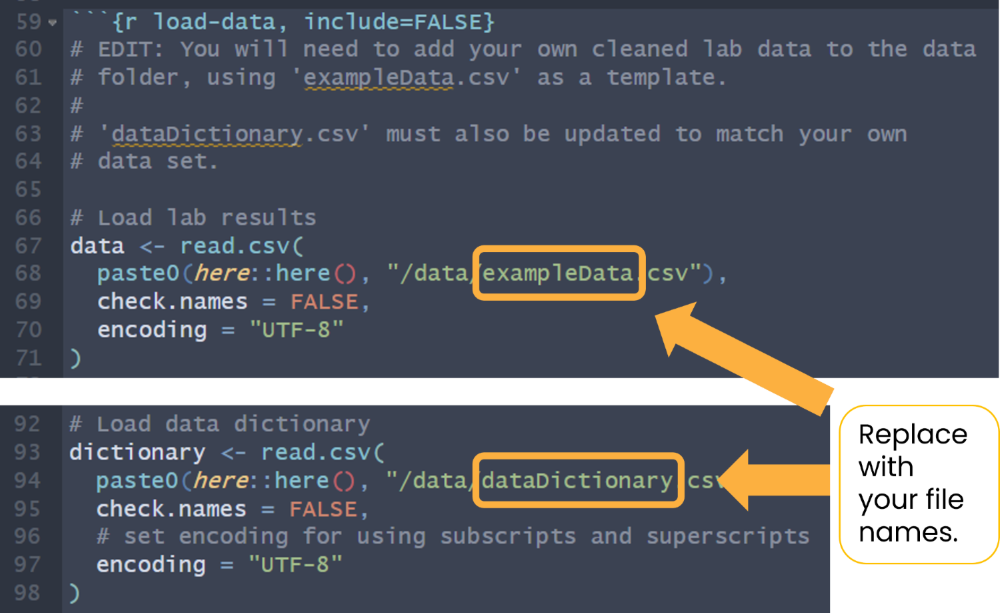
datafolder and look at thewashi-data.csvanddata-dictionary.csv.Use these as templates to replicate the column names and structure of these CSV files with your own data. All column names besides the measurements columns must be exactly the same. The measurement column names in your data must match the values in the
column_namecolumn in your data dictionary.Update the load data chunk with the names of your data and data dictionary CSV files.
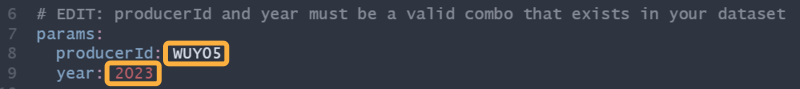
- At the top of
01_producer_report.qmd, update theproducer_idandyearto a valid combination that exists in your own data.
- Click
Renderin RStudio.
For more details on customizing the report template for your own project, head over to the article Customize the Template.